Teams managing self-hosted Zammad instances know the pain of manual deployments. It’s a time sink and a high-stakes moment. Yet for many teams, that’s still the reality. In this article, community contributor and IT generalist Michael Amponsah shares how he automated Zammad deployments and built real-time monitoring using GitHub Actions, Docker, Prometheus, and Grafana.
What this post is about
- Building a fully automated Zammad deployment pipeline
- The architecture behind the setup
- Real-world benefits: consistency and reliability
- Replicating the setup in your own infrastructure
The Case for CI/CD Pipeline
In modern IT environments, speed and reliability go hand in hand. Whether it’s a small team managing internal tools or a large support operation handling thousands of tickets, one thing is constant: systems need to stay online, secure, and up to date. Yet manual deployments often stand in the way. Each update requires logging in, pulling changes, restarting containers, and hoping for a clean boot. It’s a process that’s not only time-consuming, but also error-prone and difficult to scale.
That’s where automation comes in. A well-designed CI/CD pipeline eliminates repetitive steps, reduces human error, and delivers consistent updates. Coupled with live monitoring, it provides full visibility into your infrastructure, so you can detect and resolve issues before they affect users.
For teams using Zammad, this approach means less maintenance overhead and greater confidence in each release. To see what that looks like in practice, I created a full CI/CD and monitoring setup around Zammad.
How Zammad's Architecture Makes This Possible
Zammad's modern, open architecture with native support for Docker deployments and modular services such as PostgreSQL, Redis, Elasticsearch, and NGINX, combined with a robust REST API, creates a natural foundation for DevOps workflows.
The same principles that make Zammad easy to extend also make it easy to automate. From the moment I started building the CI/CD pipeline, it felt like Zammad was designed for this type of integration.
The Two-Layer Architecture
The setup is built around two complementary stacks that work hand in hand: one running the application itself, and another providing full operational visibility.
1. Zammad Stack (The Application Layer)
This stack contains all the services critical for Zammad's day-to-day operation. Everything here works together to process tickets, handle communication, and manage data.
Zammad (WebApp + Scheduler + WebSocket): The core application, handling the user interface, background jobs, and real-time communication.
PostgreSQL (Database): The single source of truth for all ticket data, users, and configuration.
Redis (Cache) : Provides high-speed caching and is essential for managing session data and transient job queues.
Elasticsearch (Indexing): Powers Zammad's fast, comprehensive full-text search capabilities.
NGINX (Reverse Proxy): Manages secure public traffic and routes requests to the correct Zammad web services.
2. Monitoring Stack (The Operations Layer)
This stack is dedicated entirely to observability. It continuously collects, processes, and visualizes metrics from the host server, the Docker environment, and the Zammad application layer.
Prometheus (Metrics Collection): Continuously scrapes metrics from system and container sources.
Grafana (Visual Dashboards): Transforms the raw data from Prometheus into actionable, real-time dashboards, giving instant visibility into system health.
node_exporter (Host Metrics): Collects host-level metrics from the server itself (disk usage, system load, network activity).
cAdvisor (Docker Container Metrics): captures container-specific metrics, giving granular visibility into how each service is consuming resources.
Both stacks are defined in Docker Compose files, making it simple to replicate or migrate the environment between local setups, staging, and production. This consistency eliminates the classic "works on my machine" problem.
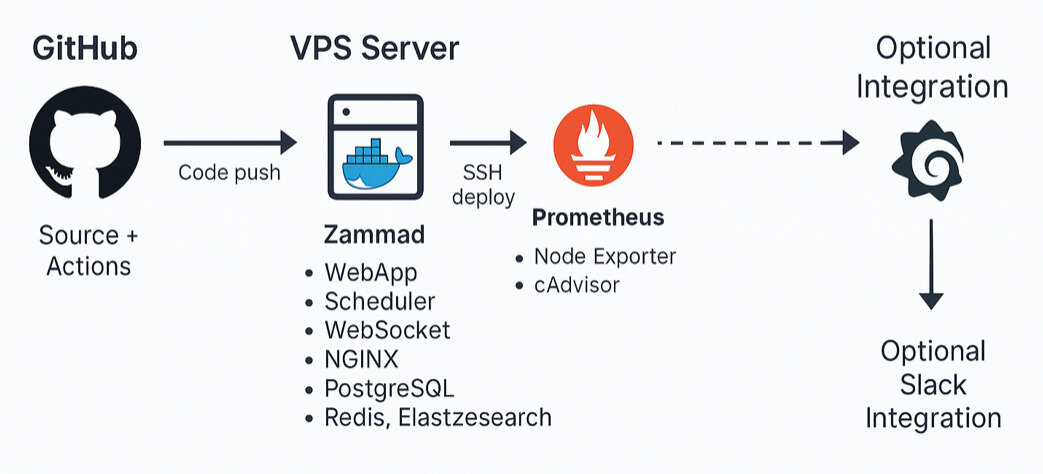
The Automation Loop: Here's How It Works
The magic happens with a few lines in a GitHub Actions workflow:
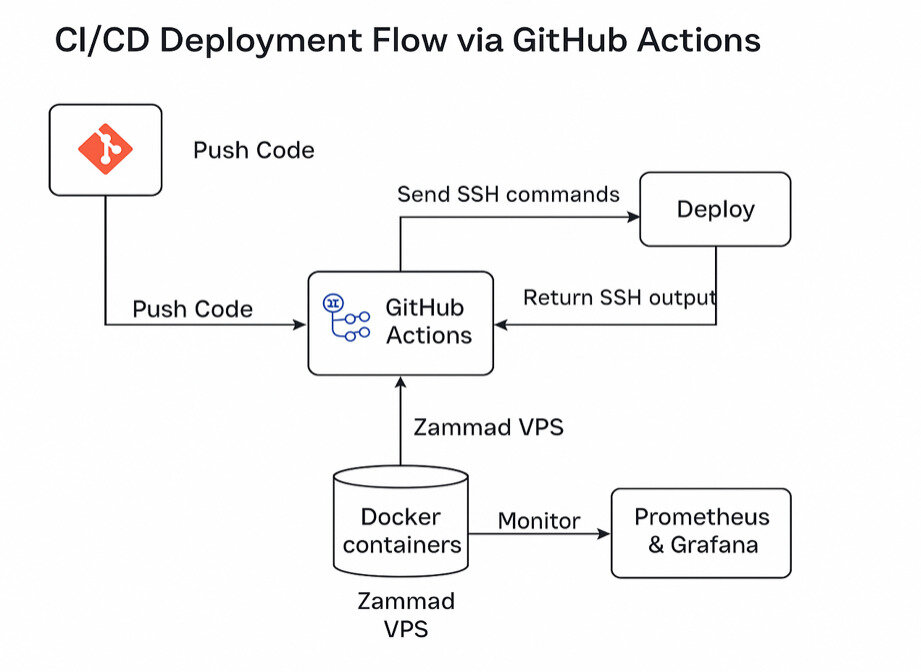
1. A push to GitHub triggers a GitHub Actions workflow.
2. The workflow connects securely to the VPS using SSH keys stored as secrets.
3. Once connected, it executes a simple, clean set of commands:
git pull origin main
docker compose -f docker-compose.yml -f monitoring/docker-compose.monitoring.yml pull
docker compose -f docker-compose.yml -f monitoring/docker-compose.monitoring.yml up -d
4. Immediately, Prometheus starts collecting metrics from the running containers.
5. Grafana provides instant visualization of everything from container health to CPU, memory, and network usage.
Results: Reliability and Peace of Mind
In production environments, automation is about consistency and reliability. By replacing manual steps with a CI/CD pipeline, we eliminate human error and leverage Zammad’s architecture to gain significant operational advantages:
-
Near-Zero-Downtime Updates: By leveraging Docker Compose, the system can pull and start new containers before stopping the old ones, allowing updates to be rolled out safely and quickly, drastically minimizing disruption to agents.
-
100% Repeatable Deployments: The deployment process is defined entirely in code (Docker Compose and GitHub Actions), guaranteeing that Zammad is configured and deployed the exact same way, every time, across development, staging, and production environments.
-
Accelerated Time-to-Value: Small updates or urgent bug fixes can be deployed within minutes of being pushed to GitHub. This high velocity ensures that users receive features faster and critical issues are patched immediately.
-
Complete System Observability: The integration of Prometheus and Grafana transforms maintenance from a reactive task to a proactive one.
-
Reduced Troubleshooting Time: When an issue does occur, Grafana provides the full historical context of system metrics, allowing you to correlate a sudden performance drop with a specific deployment or increase in user load.
Potential next steps to level things up
The beauty of a modern open architecture is that the journey to optimization never ends! Now that we have a fully automated, observable environment, here are the strategic next steps to take the Zammad operation to the next level:
-> Add Alerting: Integrate Prometheus or Grafana with a Slack channel for instant notifications on critical system incidents.
-> Expand Zammad Metrics: Go beyond system health. Use the Zammad API to track specific business data like ticket creation rate, average response times, and concurrent user load for deeper insights.
-> Enable Automated Rollbacks: Add rollback logic to the GitHub Actions workflow to automatically switch back to the previous stable container image if a new deployment fails its health checks.
-> Scale Horizontally: The ultimate goal. Move the setup from a single VPS to a Kubernetes cluster for true high availability.
It's worth giving it a try!
You can explore the full project repository and set up this pipeline on your own server. It includes the Docker Compose files, Prometheus config, and the GitHub Actions workflow you need to get started.
Check out here the full project on how to auto-deploy Zammad
About the author
Michael Amponsah is a Systems and Cloud Engineer with hands-on experience in IT infrastructure, automation, and monitoring. Passionate about open-source technologies, he enjoys building real-world solutions that integrate performance, security, and scalability. Michael constantly explores new ways to simplify complex operations through learning and collaboration.
If you’d like to connect or follow his work, visit his LinkedIn profile at: https://www.linkedin.com/in/michael-a-4b98329a