The dashboard is the first thing you see after logging in. It's where you find an evaluation of your productivity. You can also compare your statistics with the company average and see what others are doing.
This is what the dashboard looks like:
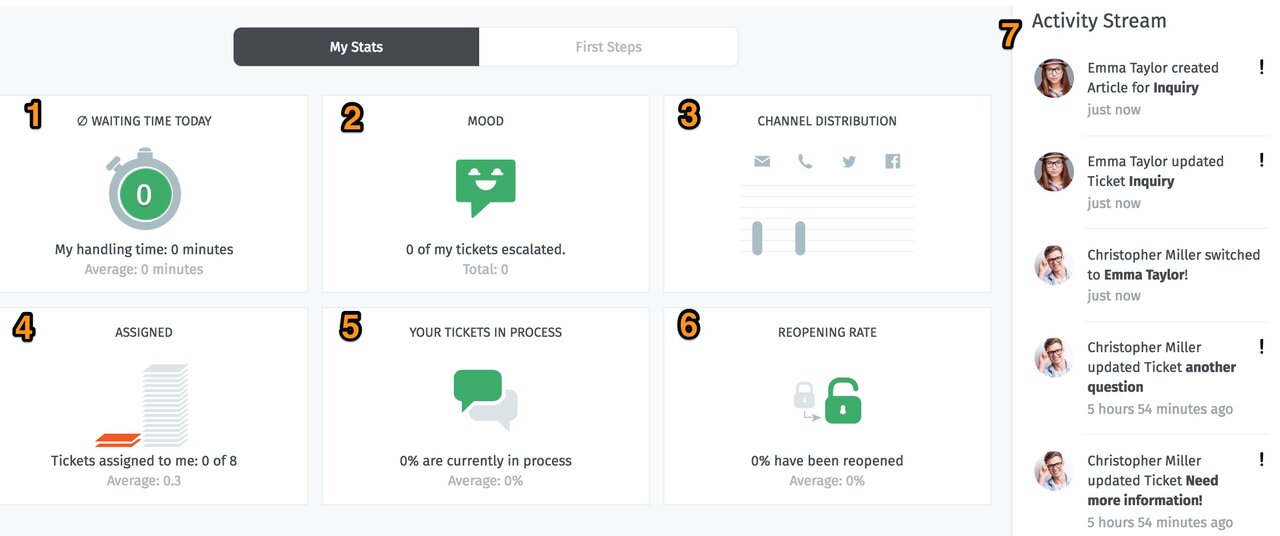
But what else can you find there?
- 1 - Waiting time today
On average, how long did customers have to wait today to get an answer from you? - 2 - Mood
How many escalated tickets do you have open at the moment? - 3 - Channel distribution
Where are your tickets coming from? (This overview shows tickets created in the last seven days, sorted by inbound vs. outbound). - 4 - Assigned
Of all open tickets (company-wide), how many are currently assigned to you? - 5 - Your tickets in process
What percentage of your tickets have you responded to or updated in the last 24 hours? - 6 - Reopening rate
How many of your closed tickets have been reopened in the last seven days? - 7 - Activity stream
What are others on your team doing right now?
With the dashboard, you'll always have everything in view and become a true productivity pro!