Grafana is a popular reporting tool and an established open-source solution. Data from numerous sources - such as InfluxDB, MySQL, PostgreSQL, Prometheus, and Graphite - is generated, analyzed and visually illustrated. As a result, trends and developments can be mapped in an easily understandable way.
Since Zammad 4.0, you have the ability to access Zammad information from third-party systems via Elasticsearch access. This allows you to create rich, customized reports in tools like Grafana:
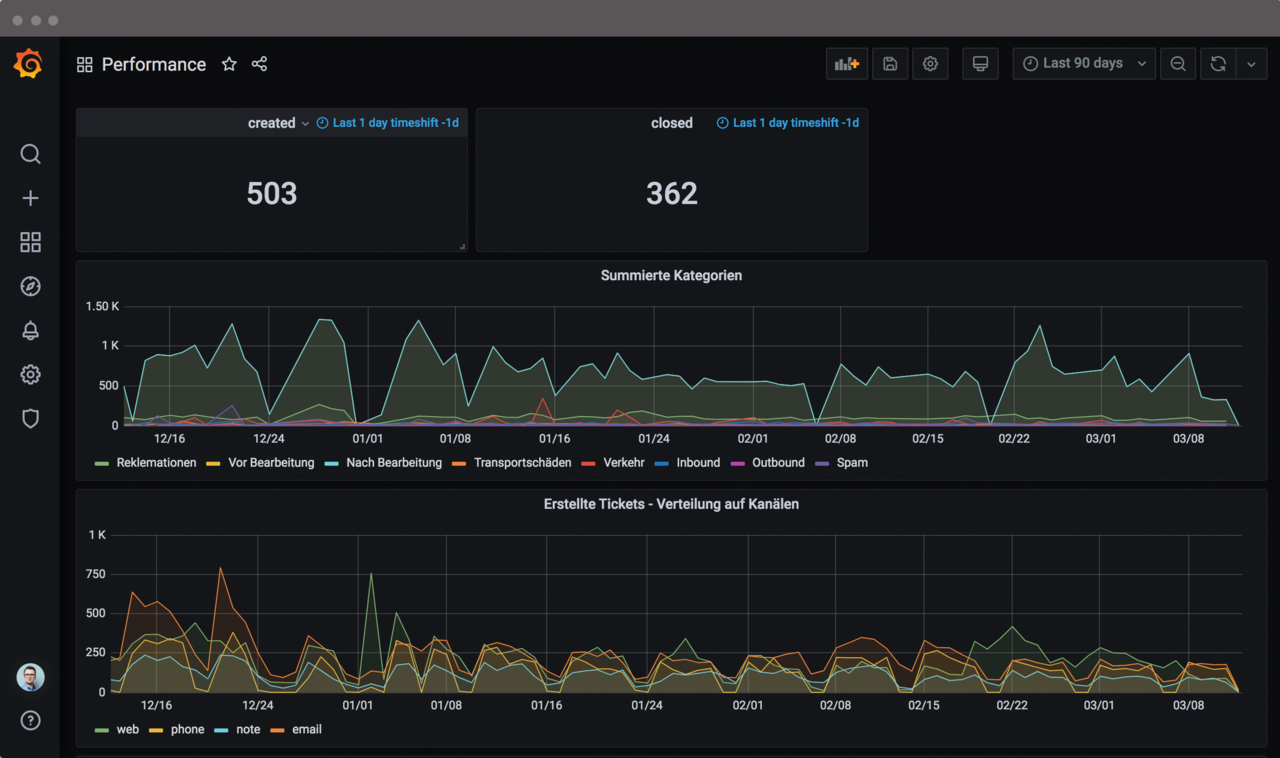
Easily build your own dashboards and analyze data on your helpdesk usage.
Check out the documentation for more detailed information.